Web-scraping for "carbon"
This inaugural blog-post describes my first experience in web-scraping, which involved obtaining historical price data from publicly visible snippets of a pay-walled news website. The exercise was partly motivated by @theecanmole’s GitHub repository containing manually “web-scraped” New Zealand Unit (NZU) price data from 2010 onwards. I wanted to automate the process by implementing a scraper, mostly because it seemed like a good exercise and, to the best of my knowledge, nobody else had done it before and made the code publicly available. So, feel free to look at and reuse my code, but I will not dwell on it here. Instead, I will just outline my approach in words, after providing a bit more context and dispelling any legal concerns; and I will compare my scraped data with @theecanmole’s.
NZU trading
New Zealand operates a domestic emissions trading scheme (NZ-ETS) with NZU as the standardized tradeable unit (permitting the holder to emit one tonne of CO2-equivalent). While the primary market for NZUs started functioning only in 2021, when the first public auctions were held to set the price for newly-issued NZUs, unused NZUs have been resold on platforms like CarbonMatch, CommTrade, and even TradeMe since 2010 (if not earlier). While this secondary market for NZUs has been developing for over a decade now, Carbon News and other news services have been providing comprehensive daily information on the progress, including regular updates on the market price movement.
Carbon News
Carbon News is described as “New Zealand’s only daily news service covering the carbon markets, climate change, sustainable business and the growth of the low-carbon economy”. It is a private business, so to read the published stories in full one must pay a subscription fee. However, some useful information can still be gleaned from headlines and short summaries visible to non-subscribers.
The Jarden NZ Market Report section lists recent stories focusing on the price of NZUs traded on CommTrade. Each story (such as this one) reports on the latest “fixing”, i.e. the spot price, as well as the opening bid and offer prices.
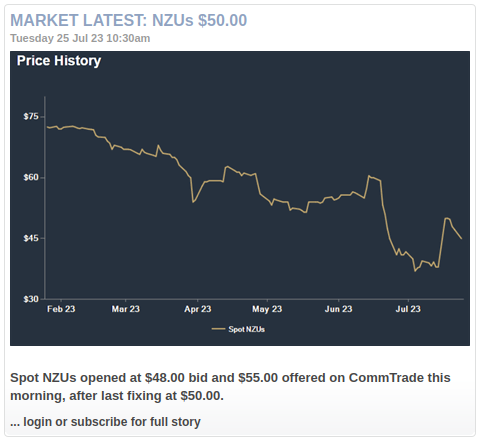
The price history plotted in the image accompanying each story covers only the previous six months, whereas Jarden NZ Market Report’s archive dates back to 2008. To graph and analyze the entire price history, one could scrape all the publicly visible NZU prices with the corresponding dates, and save this data to a local file, say a CSV file with the following format:
date,price
2023-07-24,47.25
2023-07-25,50.00
Legal concerns
Carbon News website’s robots.txt indicates that only a small number of user-agents have been explicitly disallowed from crawling, whereas everyone else should just use a crawl-delay of two seconds. This allowance suggests that the website creators do not object to the publicly visible content being scraped, and I did not find any statements in the Policies and Service sections that would point to the contrary. Hence, to the best of my knowledge and understanding, my scraping exercise does not entail illegal.
I am aware that CommTrade claim some copyright, stating that “reproduction of any data or images on this site cannot be used without the permission of Jarden.” In fact, when I first became interested in historical data on the price of NZUs, I’ve actually emailed carbon@jarden.co.nz asking for it, and they offered it to me for a fee of $5k. However, I was not willing to pay this much (if anything), and I did not feel like bargaining. Instead, I turned this obstacle into an opportunity to develop my scraping skills, using a different website as my source. Later I felt vindicated after finding a report from Exchange Data International (EDI), which concludes:
“There is no credible basis for any stock exchange in the EU (or the US) to claim copyright in closing prices or indices. Even by the most indulgent standards, closing prices are below the standards of originality and substantiality required under copyright legislation, regardless of whether they are the product of algorithms or the actual final trading price of the day.”
I think I agree with this conclusion and hope Jarden CommTrade rethink their data policy, if they haven’t already. In any case, back to legal scraping…
Content inspection
In general, data scraping involves parsing the HTML source code of a web page of interest, and in the present case we have two to begin with: Jarden NZ Market Report and its archive. By scrolling through these two webpages one can glean all the information required to produce the desired CSV file: the date, the price, and the story URL.
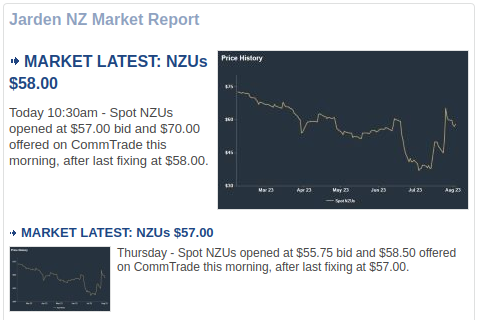
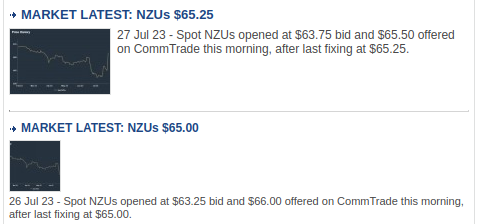
Somewhat inconveniently, the date formatting is variable: showing just “Today” or the appropriate weekday (e.g. Thursday) for stories that are less than a week old, and the date in full (e.g. “25 Jul 23”) stated only for older stories.
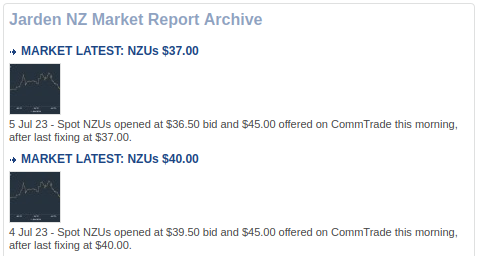
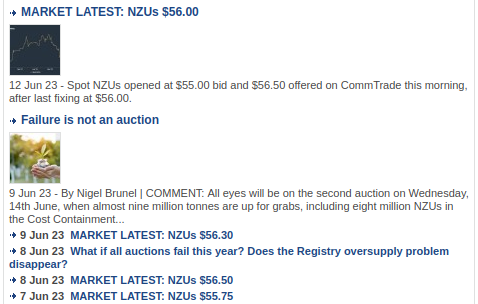
Much more inconvenient is the variation in how the spot price has been reported over time, systematically featuring in the headlines only since 22 Feb 2016. Extracting the spot price from hundreds of older archived stories actually requires opening and parsing the stories’ individual web pages. Adding to the inconvenience is that the format of the publicly visible summaries changed fairly inconsistently over time, especially in early years, raising the question of whether it is even possible to extract all the right price values using relatively simple algorithm logic.
Using the browser’s inspection tool to examine the HTML source code of the Jarden NZ Market Report, we find a fairly tractable structure. The central listing of stories is associated with a <div> element of class "StoryList". Inside this element, the latest headline in the listing is associated with the element tagged by <h1>, the following six headlines are each tagged by <h2>, and the remaining ones by <h3>; and all these elements have the same class name "Headline" attributed to them. The actual headline text is nested inside an <a> sub-element with an href attribute (providing a URL fragment directing to the full story). Furthermore, each and every headline element is followed by an accompanying <p> element containing the story’s brief summary.
Inspection of the archive shows continuation of the same general pattern: first twenty stories in the archive are associated with <h3> elements (containing the headline) and accompanying <p> elements (containing the summary); while all older stories are tagged by <h4> and are not accompanied by <p> elements. For these older archived stories, the full date is embedded in the corresponding <h4> element but outside the internal <a> sub-element.
HTML structure of each and every story’s web page is comparatively simple: the publicly visible text summary is spread over two consecutive <div> elements: one of class "StoryFirstPara"; and the other of class"StorySecondPara".
Scraping with Python
Having gleaned the underlying HTML structure, I proceeded with the actual data scraping using Python in a Jupyter notebook. I did it in three stages.
First I scraped the date, headline, and URL for all the stories listed in the Jarden NZ Market Report and its archive. I used a Python package called Beautiful Soup to parse the HTML and extract the text with the three relevant pieces of information.
Then I wrote a custom function called strings2date to convert all the date strings into date objects using Python’s datetime module. This conversion enabled me to discard all the stories published prior to 14 May 2010, because we know that updates on the spot price have not been reported before then.
The third and final stage involved extracting the spot price either from the headlines I have already just scraped, or from the text summaries scraped from the stories’ individual web pages, accessed via their respective URLs. I implemented the parsing logic for the headlines and the summaries in two different functions, parse_headline and parse_summary, with the latter being slightly more complicated, but both relying on standard string functions and searching for fairly simple patterns in the text.
Again, feel free to inspect my Jupyter notebook and file scraping_functions.py for implementation details. In the remainder of this post I will just focus on the result and compare it with @theecanmole’s raw data.
Dataset comparison
Figure below shows a plot of 2145 datapoints (in red) that I’ve scraped from Carbon News, as well as a (blue) line tracing the 1653 datapoints in @theecanmole’s dataset.
It is reassuring to see that the two overlaid plots are almost indistinguishable, but not quite. Even though my dataset has more points in total, it is actually more sparse than @theecanmole’s for years up to and including 2013, when @theecanmole relied on multiple other sources.
Surprisingly, my dataset contains no price values from 2012, even though some of @theecanmole’s datapoints for that year are sourced from Carbon News. While it is entirely possible that my text parsing logic has missed some values, it also appears to be the case that some of the older market updates have not actually been archived. For example, @theecanmole’s price value of $8.30 from 16 Dec 2011 cites a Carbon News article with unique storyID=5808 and a valid URL, but my crawling scraper failed to discover this URL, simply because the story is not listed on Jarden NZ Market Report Archive. This realization makes me even more appreciative of @theecanmole’s efforts.
Future updates
Scraping NZU price history from Carbon News was intended as a one-off learning experience. However, I plan to regularly update my dataset as new daily prices are reported on the Jarden NZ Market Report. In another post I might write about how this updating process could be automated and deployed on AWS (using a free-tier EC2 instance), but until then I will simply be re-running the first two code cells of my Jupyter notebook.
